

KEY TAKEAWAYS
An unchanged world forecast is not an unchanged credit outlook. The IMF cuts 2026 emerging-market growth by 0.2 percentage point from April while global growth holds steady.
Saudi Arabia requires a changed view, not an oil-price shortcut. The October WEO projects a 3.3% contraction in 2026.
The policy response can matter as much as the shock. IMF simulations put the fiscal cost of broad price interventions at 3-22 times targeted transfers, depending on the case.
A rebound is a conditional path, not cash in hand. The baseline assumes Hormuz reopening resumes in March 2027.

What Paid for the Stability?
The October WEO leaves 2026 world growth at 3.1%, unchanged from April, but changes who carries it. Advanced economies receive an upgrade. Emerging-market and developing economies receive a downgrade. The aggregate is stable because different movements offset, not because each borrower has become more resilient. For a sovereign creditor, the relevant question is what sustained activity cost the budget and the external balance. IMF, October WEO, Table 1.1, p. 10.
Resilience financed by drawing down a buffer is different from resilience produced by a stronger economy. The Fund describes inventory use, rerouted shipments and fiscal support alongside a technology investment boom. Some adjustments can endure; others spend protection that will not be available twice. Our task is to distinguish them before a reassuring GDP number becomes a reassuring credit conclusion.
This desk’s October framework follows the cash beyond the headline. A growth improvement matters when it strengthens revenue, usable foreign exchange or the capacity to service debt. A successful funding operation matters when it improves the payment schedule, not merely the appearance of liquidity. The full assessment below sets out the forecast changes, the policy choices that preserve buffers, and the evidence that changes our existing country views.
The Aggregate Hides the Transfer
The 2026 forecast has shifted away from emerging economies even while world growth stands still. The October table puts advanced-economy growth at 2.1%, up 0.3 percentage point from April, and emerging-market growth at 3.7%, down 0.2 point. In 2027, the Fund projects world growth of 3.4%, up 0.2 point. Those are changes in real growth forecasts, not changes in debt-service capacity. The latter also depends on financing costs, exchange rates, revenue collection and the starting debt stock.
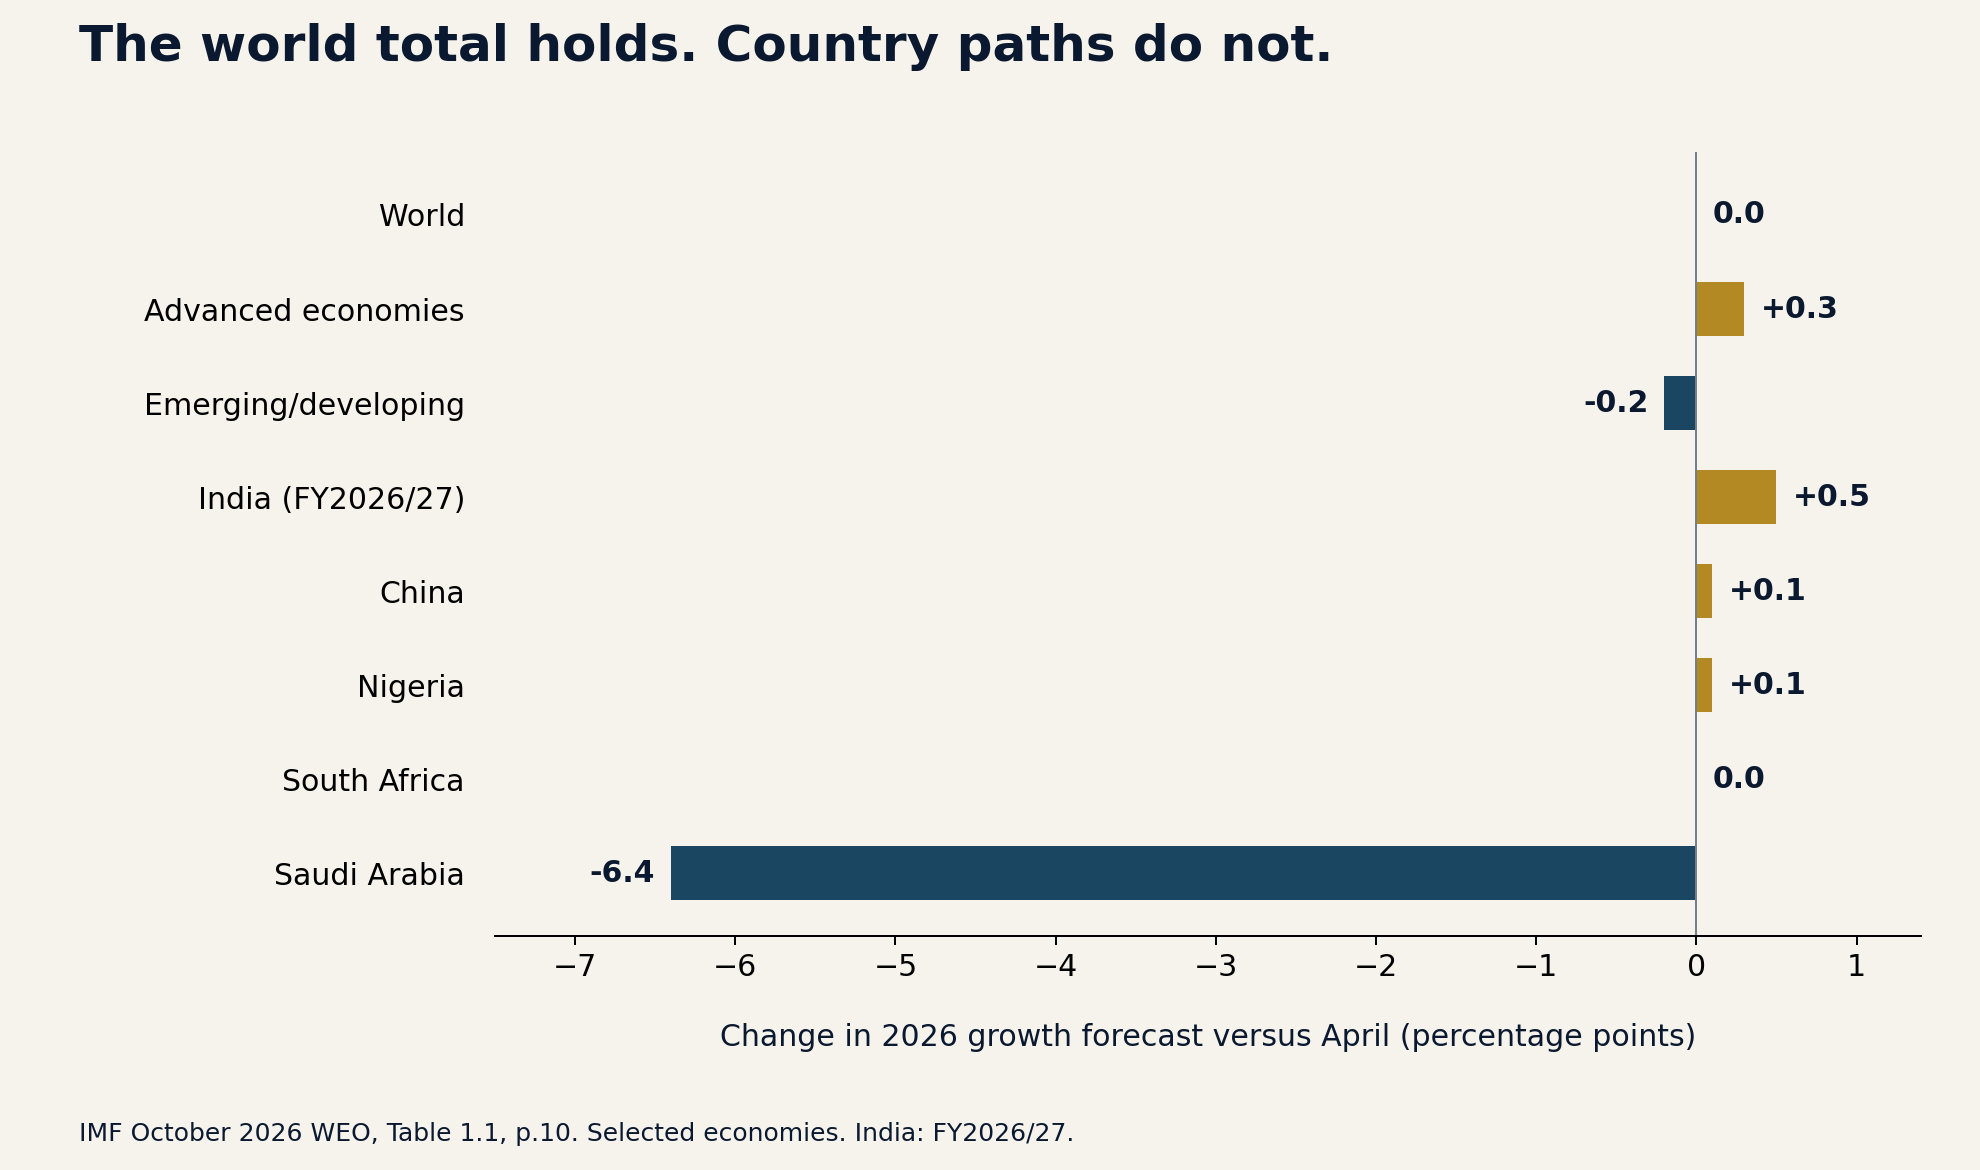
Source: IMF October 2026 WEO, Table 1.1, printed p. 10. Percentage-point revisions to 2026 real GDP growth versus April. Selected countries are illustrative, not a complete ranking. India’s table entry is FY2026/27.
Saudi Arabia and Nigeria show why an exporter label is too coarse. The Fund now projects Saudi output contracting 3.3% in 2026, a 6.4-percentage-point downgrade from April. Nigeria’s forecast is 4.2%, an upgrade of 0.1 point. Higher commodity prices can support one producer while impaired production and delivery dominate another. The credit question starts with saleable volume and collected revenue, not the international oil benchmark alone.
Asia’s stronger aggregate is not permission to treat its borrowers as one trade. India’s forecast rises to 7.0% for FY2026/27, up 0.5 point from April. China’s calendar-2026 forecast is 4.5%, up 0.1 point. These numbers use different reporting periods; their revisions are informative, but a casual league table of growth rates would obscure that distinction. Neither upgrade establishes a bond valuation or removes country-specific fiscal and financial risks.
Romania prevents the global argument from becoming only an energy-exporter story. The WEO projects a 0.5% contraction, 8.2% average inflation and a current-account deficit of 7.0% of GDP in 2026. That combination makes the composition of adjustment central: demand restraint can narrow an external gap while also weakening the revenue base. A smaller deficit is more durable when competitiveness and financing improve, not simply when imports fall with activity. This is a monitoring implication, not a new allocation call. Annex Table 1.1.1, p. 39.
Read the Recovery Conditions
The recovery depends on a physical timetable, not merely a diplomatic announcement. The WEO assumes that reopening of the Strait of Hormuz resumes in March 2027 and that conditions broadly return to their prewar state by October 2027. Production, shipping, insurance and payments recover gradually. For creditors, this makes throughput and the reliability of settlement more useful tests than a single headline about de-escalation. Chapter 1, p. 8.
A high spot oil price cannot, by itself, falsify the Fund’s annual assumption. Its working oil-price assumptions are $95.74 for 2026 and $87.39 for 2027, using the simple average of Brent, Dubai Fateh and WTI. They are annual averages, not targets for today’s Brent price. Our latest The Double Invoice examined a reported $110 Brent print. Comparing those two numbers as if they measure the same thing would manufacture a forecast miss. The useful question is whether sustained prices, volumes and delivery costs undermine the expected recovery.
Recent official commentary reinforces the mechanism without supplying a fresh set of forecasts. At its October 15 regional briefing, the IMF highlighted alternative routes and inventory drawdowns as cushions, while warning that policy buffers were narrowing. That is confirmation of the October framework, not a separate forecast upgrade. It raises the importance of measuring how long the cushions can last.
The upside case deserves equal discipline. The WEO assumes the AI investment cycle moderates and adds no exogenous AI productivity boost to the baseline. Faster diffusion could support activity and revenue more than projected. But technology-related demand can also raise energy and infrastructure needs. Our inference is conditional: export strength is more credit-positive when it yields retained FX and taxable income without an offsetting call on public power investment or subsidies.

Protection Has a Funding Choice
The WEO’s most useful credit lesson may be in its household-policy chapter. Protecting vulnerable households need not mean suppressing prices for everyone. Chapter 2 models the fiscal cost of achieving comparable protection through different instruments. Across its cases, broad price interventions require roughly 3-22 times the fiscal resources of targeted transfers. This is a model result across specified shocks and economy types, not a forecast of any named country’s subsidy bill. Chapter 2, pp. 61-64.
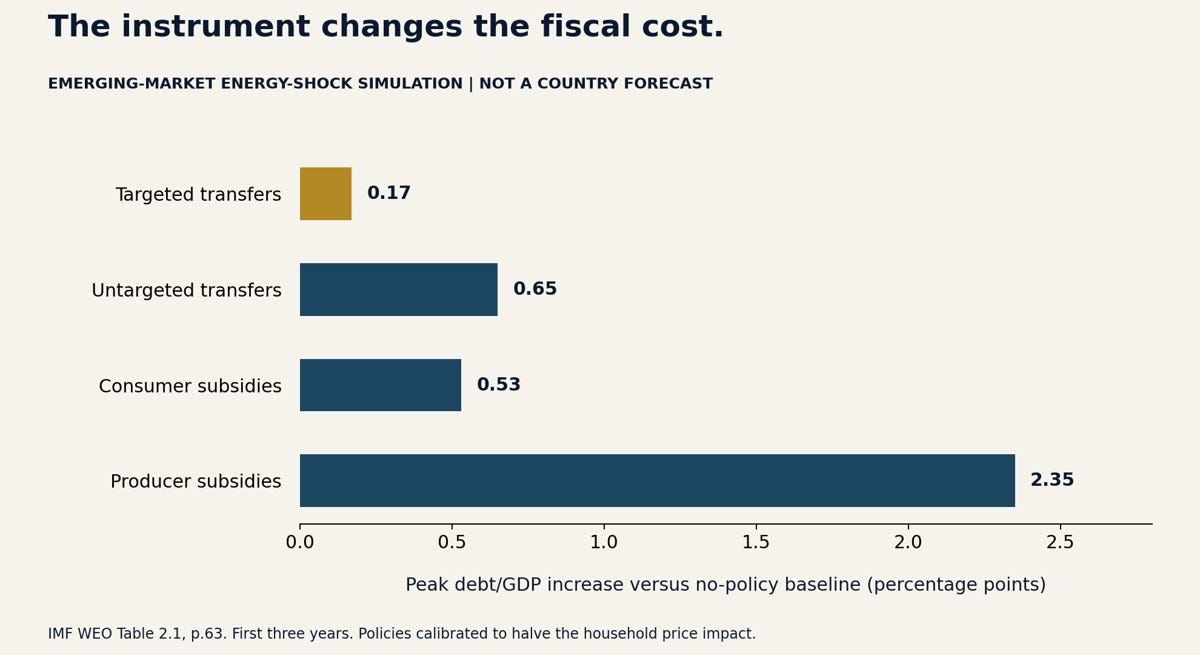
Source: IMF October 2026 WEO, Table 2.1, p. 63. Emerging-market energy-shock simulation. Bars show the peak increase in debt/GDP relative to the no-policy baseline during the first three years, in percentage points. Instruments are calibrated to contain half the household impact of higher consumer prices. These are model outcomes, not country forecasts.
The implementation constraint is part of the credit analysis. Targeted support only works if governments can identify recipients and deliver funds. The chapter’s model abstracts from some implementation difficulties; its policy discussion allows limited price measures where urgent needs and weak capacity constrain alternatives. A promised transfer system is therefore not equivalent to an operating one. The creditor should examine funded allocations, delivery records and sunset provisions, not just the announced policy label.
Nigeria remains a test of cash retention rather than a referendum on oil. The June 2026 country report recommends saving most temporary windfalls or retiring expensive debt, while preserving targeted household support. In The Double Invoice, we applied that test to a reported fuel discount. The WEO strengthens the mechanism behind that caution; it does not establish the discount’s cost or prove that reform has reversed. We retain the fiscal-execution caution until the support’s funding, duration and use of remaining oil receipts are clear.
Domestic financing can move the pressure rather than remove it. The WEO finds an association between higher bank holdings of government securities and lower private lending, particularly in high-debt economies. That is not proof that every government issue displaces a private loan. It does identify a second-round risk: support financed through local banks can protect consumption today while constraining investment and the future tax base. A closed external funding gap is not the end of the investigation. Chapter 1, pp. 16-17, Figure 1.13.
Where This Desk Changes Its Mind
Saudi Arabia moves from Asymmetry to Cautious over three months. The Double Invoice retained the July country report’s 1.7% growth baseline while weighing higher oil receipts against disruption. The October WEO now projects a contraction of 3.3%. The older growth number is superseded, and our earlier framing did not give enough weight to the newer output path. We correct that here. This is a change in our fundamental risk assessment, not a claim that Saudi bonds are mispriced.
The 2027 Saudi rebound does not remove the intervening cash-flow test. The WEO’s 7.9% growth forecast follows the projected 2026 contraction and depends on normalization. The July Article IV described ample fiscal and external buffers and recommended spending reprioritization before wider support. Those buffers are an important counterweight to caution. What would reverse our stance is sustained recovery in physical deliveries and non-oil activity, with bounded support costs and intact buffers, rather than the rebound percentage alone.
The Philippines requires continuity rather than a second discovery. The WEO carries 2026 average inflation of 5.6% and a current-account deficit of 4.8% of GDP, matching the September 25 mission statement. We already corrected our baseline in The Double Invoice. The Cautious rates and external-balance view persists, but the WEO is confirmation, not a fresh adverse surprise. The mission also made further tightening conditional on persistent inflation and stronger second-round effects; a supply shock alone does not establish the next rate decision.
Saudi external sovereign credit
October assessment: Change: Cautious, 3M. New output path supersedes the July baseline.
Evidence that matters next: Deliveries, non-oil activity and support costs; recovery with preserved buffers would reverse caution.
Nigeria fiscal execution
October assessment: Retain: Cautious, 3M. A temporary windfall should not create a permanent obligation.
Evidence that matters next: Funded, time-limited support and savings or debt retirement from remaining receipts.
Philippines rates/external balance
October assessment: Retain: Cautious, 3M. October confirms September’s inflation and external pressures.
Evidence that matters next: Easing food inflation and external deficit without renewed tightening or persistent support.
Romania adjustment
October assessment: Monitor, not a new allocation. Weak activity and a large external deficit require a composition check.
Evidence that matters next: Financing quality, revenue execution and the source of external adjustment.
These cautious views concern different risks and are not a blanket underweight of emerging markets. Saudi Arabia is a physical-recovery and buffer test; Nigeria is a policy-execution test; the Philippines is a persistence and external-adjustment test. Our preference is for verifiable cash retention and funded adjustment rather than an exporter, reformer or technology label. Position size and relative value remain separate decisions from this fundamental framework.

Access Is Still Not Repayment
The distinction in The Access Premium survives the October reset. Our Laos analysis separated the ability to issue debt from the ability to repay it. The same discipline applies to a sovereign managing a terms-of-trade shock: new borrowing may refinance a near-term payment, fund productive resilience, or finance recurring support. Those uses have different consequences. An available funding channel is valuable, but only the use of proceeds and subsequent cash generation show whether it improves the debt path.
The sequence matters more than a single debt ratio. A nominal GDP increase can mechanically lower debt/GDP even as interest consumes more revenue. A reserve increase financed by new borrowing can improve immediate liquidity without reducing net liabilities. A subsidy can temporarily lower measured inflation while raising the financing requirement. These are accounting and transmission risks to test, not claims that all three are occurring in every covered country.
A durable improvement would combine recovery with replenishment. We would become less cautious if physical supply normalizes, targeted support reaches households without becoming permanent, and stronger receipts rebuild cash or retire expensive debt. The alternative is an economy that repeatedly meets its growth forecast by using more of the balance sheet. The GDP line may look similar. The protection available to creditors does not.
The Next Test Is Replenishment
October is our medium-term reference, not a view frozen until April. Our usual Sunday and Wednesday publications will test new evidence against its recovery assumptions, policy choices and financing conditions. The January WEO update provides an interim checkpoint before the usual April full report. Our next two pieces will apply this framework to Asia’s uneven external-income channels and sub-Saharan Africa’s fiscal and financing constraints. They will not repeat the global summary.
The signal is what remains after the economy absorbs the shock. Count the receipt. Trace the obligation. Check what is replenished. Growth is the opening line, not the credit conclusion.
What Would Change Our Mind
Physical normalization arrives sooner. Sustained recovery in shipping, production and payment arrangements would weaken the case for prolonged buffer use.
Protection preserves fiscal capacity. Funded, targeted and time-limited support, alongside savings or debt retirement, would improve the policy assessment.
The next evidence changes the path. Subsequent inflation, external-balance and fiscal releases, followed by the January 2027 WEO update, must test October’s projections rather than be described as surprises already in the baseline.
Regards,
Sovereign Dispatcher
Source Notes
Original IMF October 2026 WEO: Table 1.1 (p. 10); assumptions (p. vi and pp. 8-9); sovereign-bank evidence (pp. 16-17); regional tables (pp. 39-43); policy simulations and caveats (pp. 61-64). Forecast revisions in Exhibit 1 are the IMF’s published differences from April, based on rounded values. Fiscal-year conventions apply where noted. Illustrations are conceptual, not documentary photographs. Country views are EMA analysis; IMF projections and model simulations are identified separately.